
Leadership experience prior to Sirius Analytical
When analytical bias becomes an operational issue
Analytical results become inputs into reconciliation, process control, resource understanding and commercial decisions. At Bisha, analytical monitoring identified persistent bias in zinc reporting.
Observation and evidence
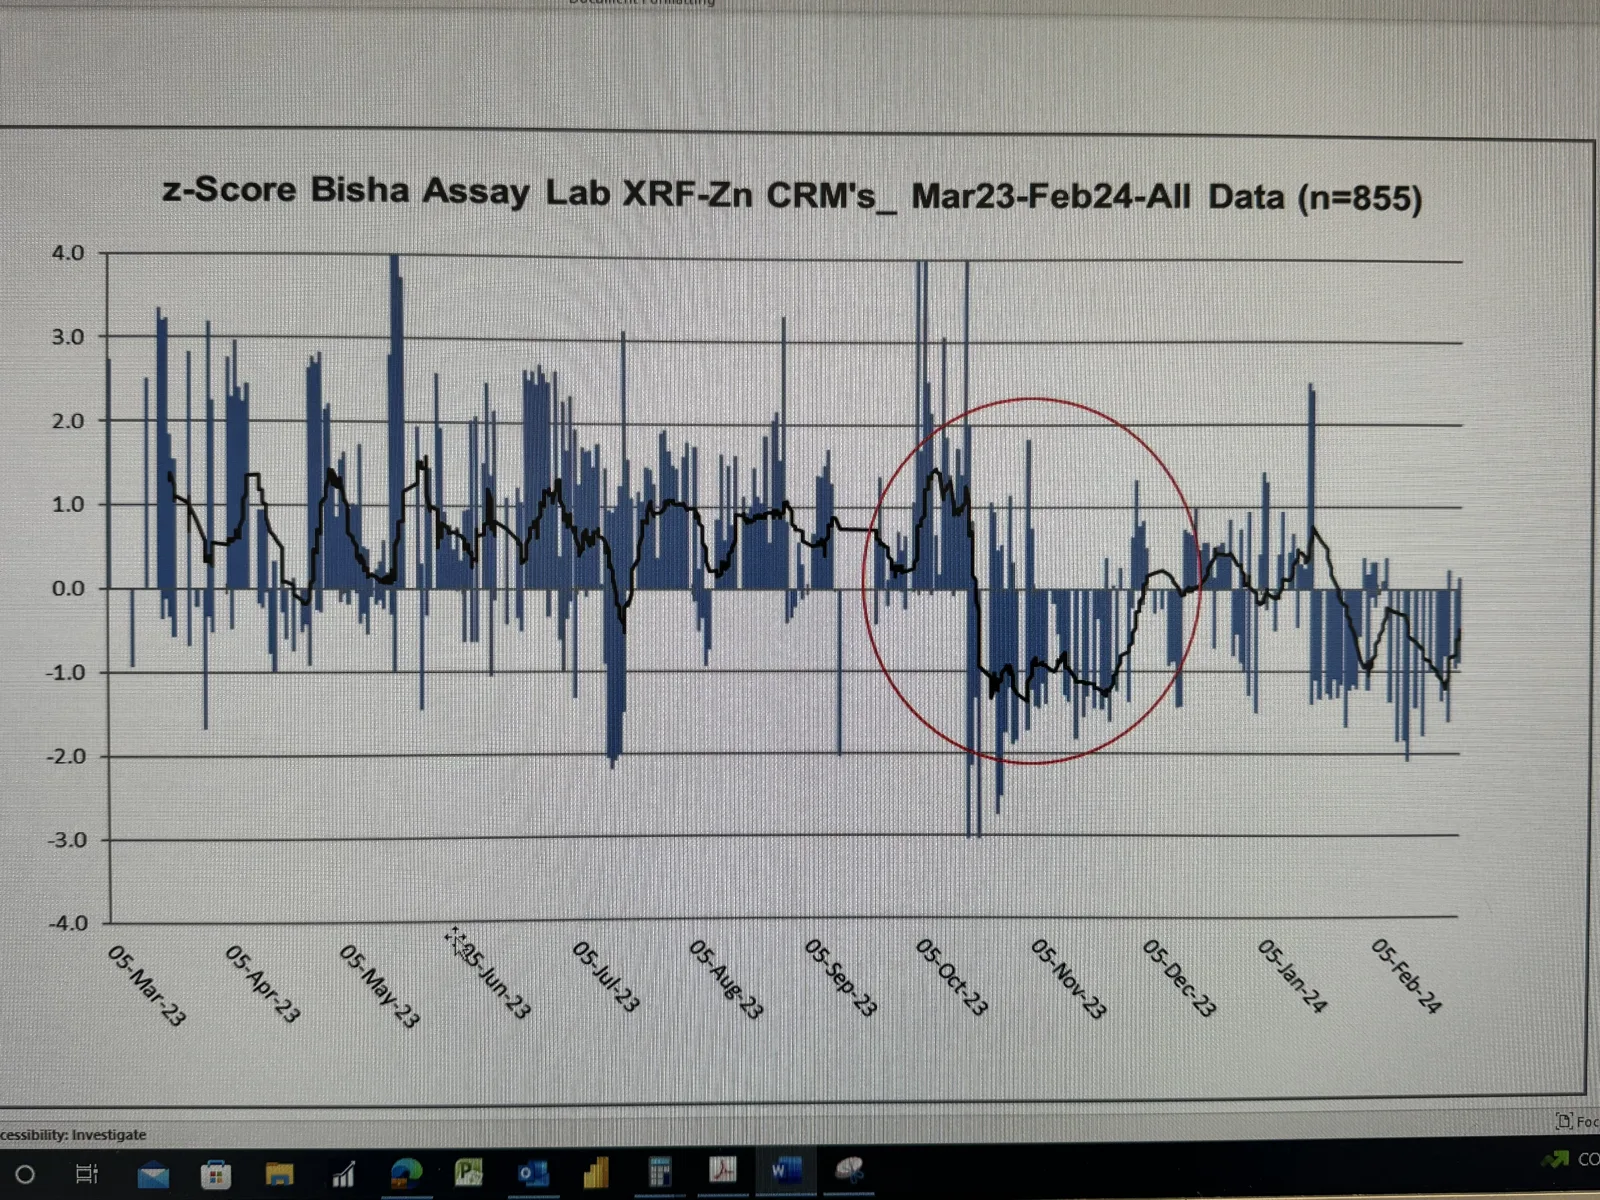
Original chart photograph. The z-score trend supports investigation of analytical performance; a z-score cannot by itself establish the magnitude of a bias in Zn percentage points.
- Observation
- Persistent positive zinc-reporting bias required investigation.
- Evidence
- Available QC trends and the November 2022 zinc-concentrate investigation, including preparation calculations, drift monitoring, method performance and comparison with external analytical information.
- Action
- Investigate preparation-stage calculations, suitable drift-monitoring standards and method validation.
- Outcome
- The record documents an investigation and corrective-action programme. A quantified post-intervention reduction is not established by the supplied evidence.
- Basis
- Historical leadership experience, not a Sirius corporate contract. The investigation’s approximately 0.5% uncertainty/bias discussion is distinct from the illustrative 0.6 percentage-point scenario below.
Operational significance
Why it mattered
A systematic analytical difference can become significant when applied across mining-scale tonnage.
The implication depends on the analytical stream, the quantity represented, the magnitude and direction of the difference, and how the result is used. Reconciliation exposure alone does not establish a commercial settlement loss.
Assumptions → calculation → interpretation
An illustrative reconciliation scenario
This calculation shows sensitivity to an assumed grade difference. It is not a reconstruction of measured annual losses at Bisha.
| Input | Value | Classification |
|---|---|---|
| Annual mill throughput | 3.0 million tonnes | Scenario assumption |
| Zn feed grade | 5% | Scenario assumption |
| Zn recovery | 88% | Scenario assumption |
| Zn concentrate grade | 50% | Scenario assumption |
| Positive grade difference | 0.6 percentage points (0.006 as a fraction) | Scenario assumption |
Recovered zinc: 3,000,000 × 0.05 × 0.88 = 132,000 t/year.
Concentrate mass: 132,000 ÷ 0.50 = 264,000 t/year.
Analytical reconciliation exposure: 264,000 × 0.006 = 1,584 t contained Zn/year.
Calculated exposure under stated assumptions. This is not lost metal, realised revenue loss or financial loss. The 0.6 percentage-point input is an illustrative assumption and is not presented as an independently verified measurement from the historical report.
From laboratory control to decision confidence
What this demonstrates
Quality control should help management understand whether analytical information is reliable enough for the decisions that depend on it.
A batch pass/fail result is one control. Trend monitoring, investigation, method understanding and verification of corrective action provide the wider assurance.